
Monitoring of biophysical parameters
The service monitors the status of crop stands in terms of basic biophysical parameters using satellite data:
Chlorophyll content
Chlorophyll content describes the amount of photosynthetically active pigments in the foliage of vegetation, which influences the overall photosynthetic activity of plants. During the growing season, the chlorophyll content can be used as an indicator of the health of the vegetation, where higher values usually correspond to better thriving vegetation and, on the contrary, significantly low values may indicate damage to the vegetation. During crop maturation (especially in cereals and rape), there is a natural decline in chlorophyll content. In this case, the product can be used, for example, to monitor selective crop maturation. This can be used, for example, to optimise harvest management.
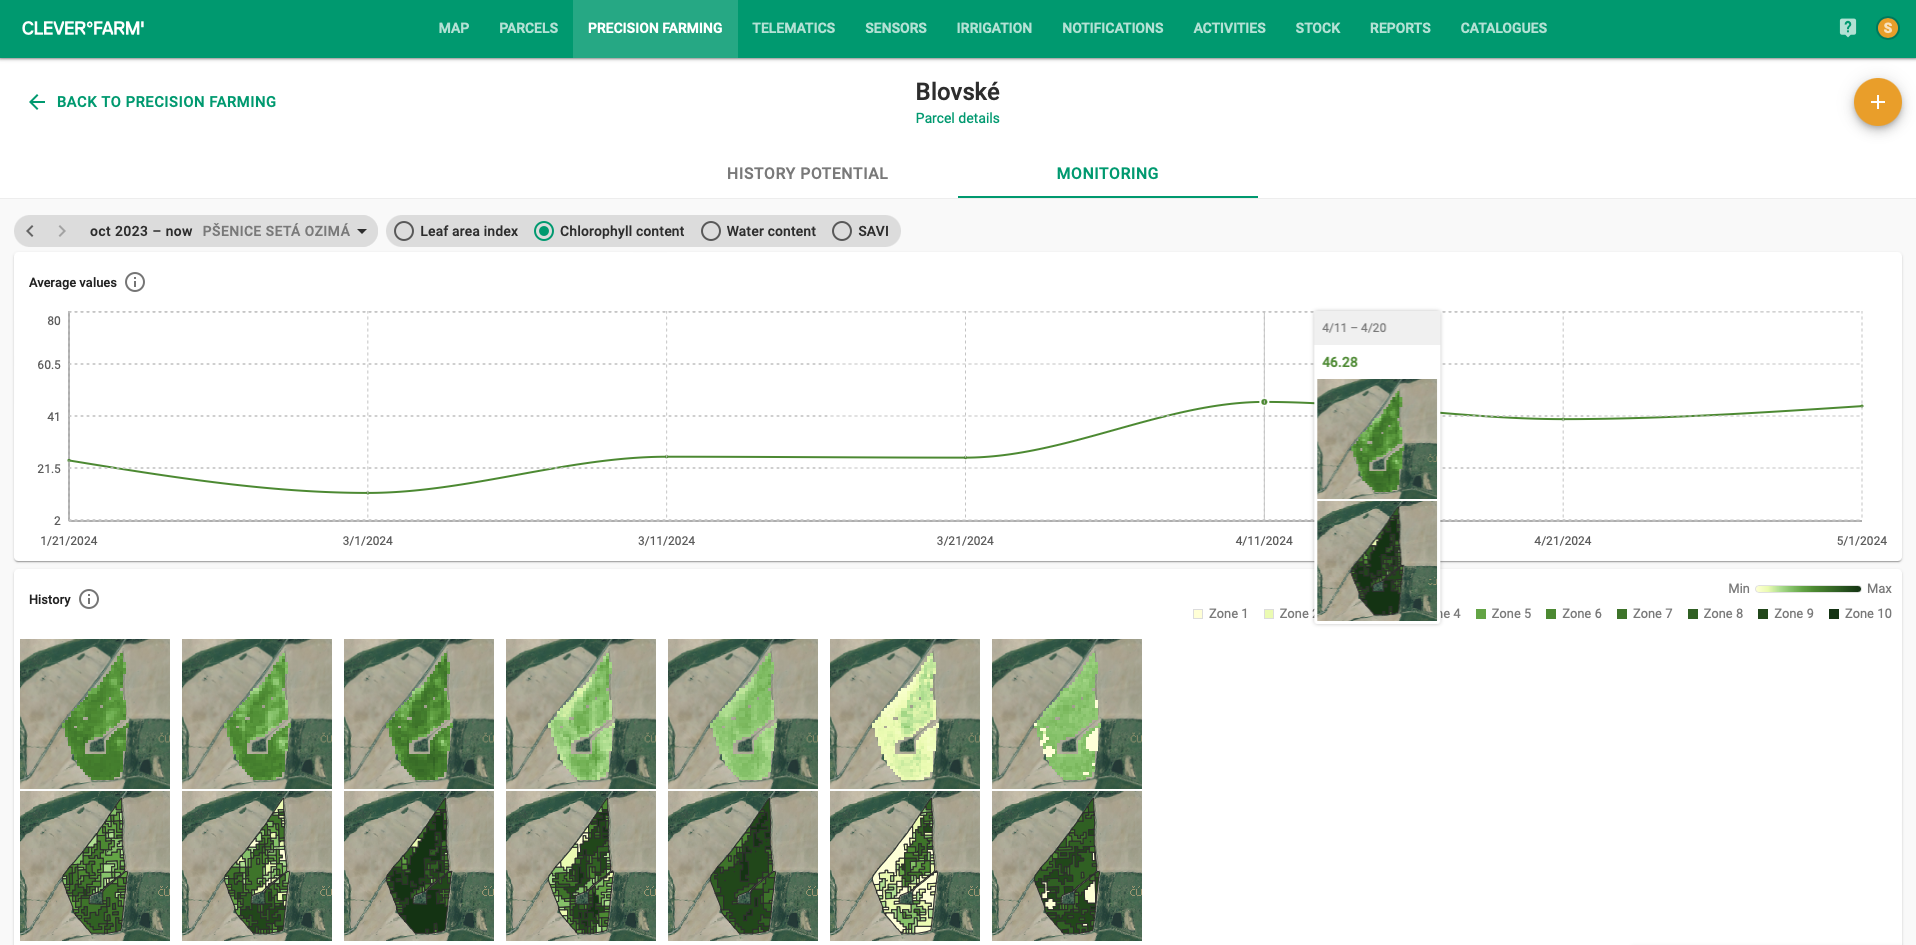
Fig. 1: Change in chlorophyll content of a wheat stand.
Water content
Water content describes the amount of water in the vegetation foliage expressed as Equivalent Water Thickness, which informs about the water supply status of the plants. It is a very dynamic parameter whose value is strongly influenced by the availability of water in the soil or the nature of the weather (rainfall, temperature...). The water content can in some cases be used as an indicator of vegetation damage due to drought. During the maturation of crops (especially cereals and rape), there is a natural decrease in water content, and similarly to chlorophyll content, water content can be used to monitor selective maturation of crops.
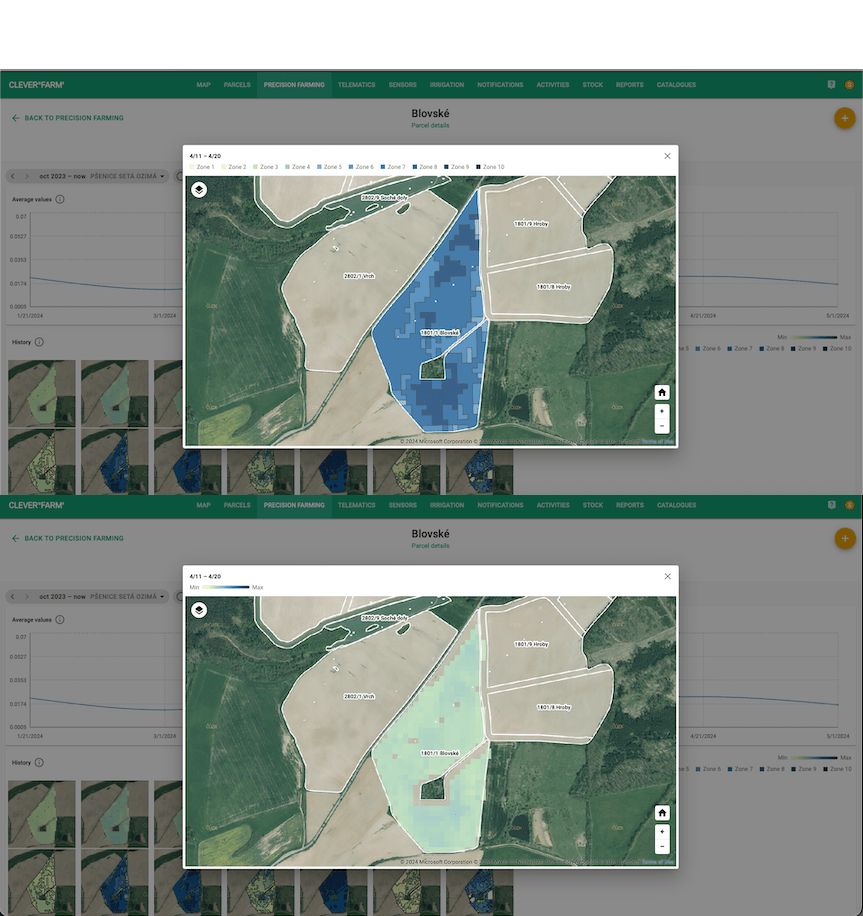
Fig. 2: Legend with water content levels in the vegetation
Leaf area index
The Leaf Area Index (LAI) is defined as the ratio of the total leaf area of the stand to the unit surface area. This makes it a dimensionless parameter. In contrast to chlorophyll and water content (characterising the de facto leaf area of the vegetation), LAI is a parameter describing the stand as a whole. It can be used as an indicator of the "density" of the stand, and indirectly also as an indicator of the amount of biomass. For example, by monitoring changes in leaf area index values over time, the size and rate of vegetation growth can be monitored.
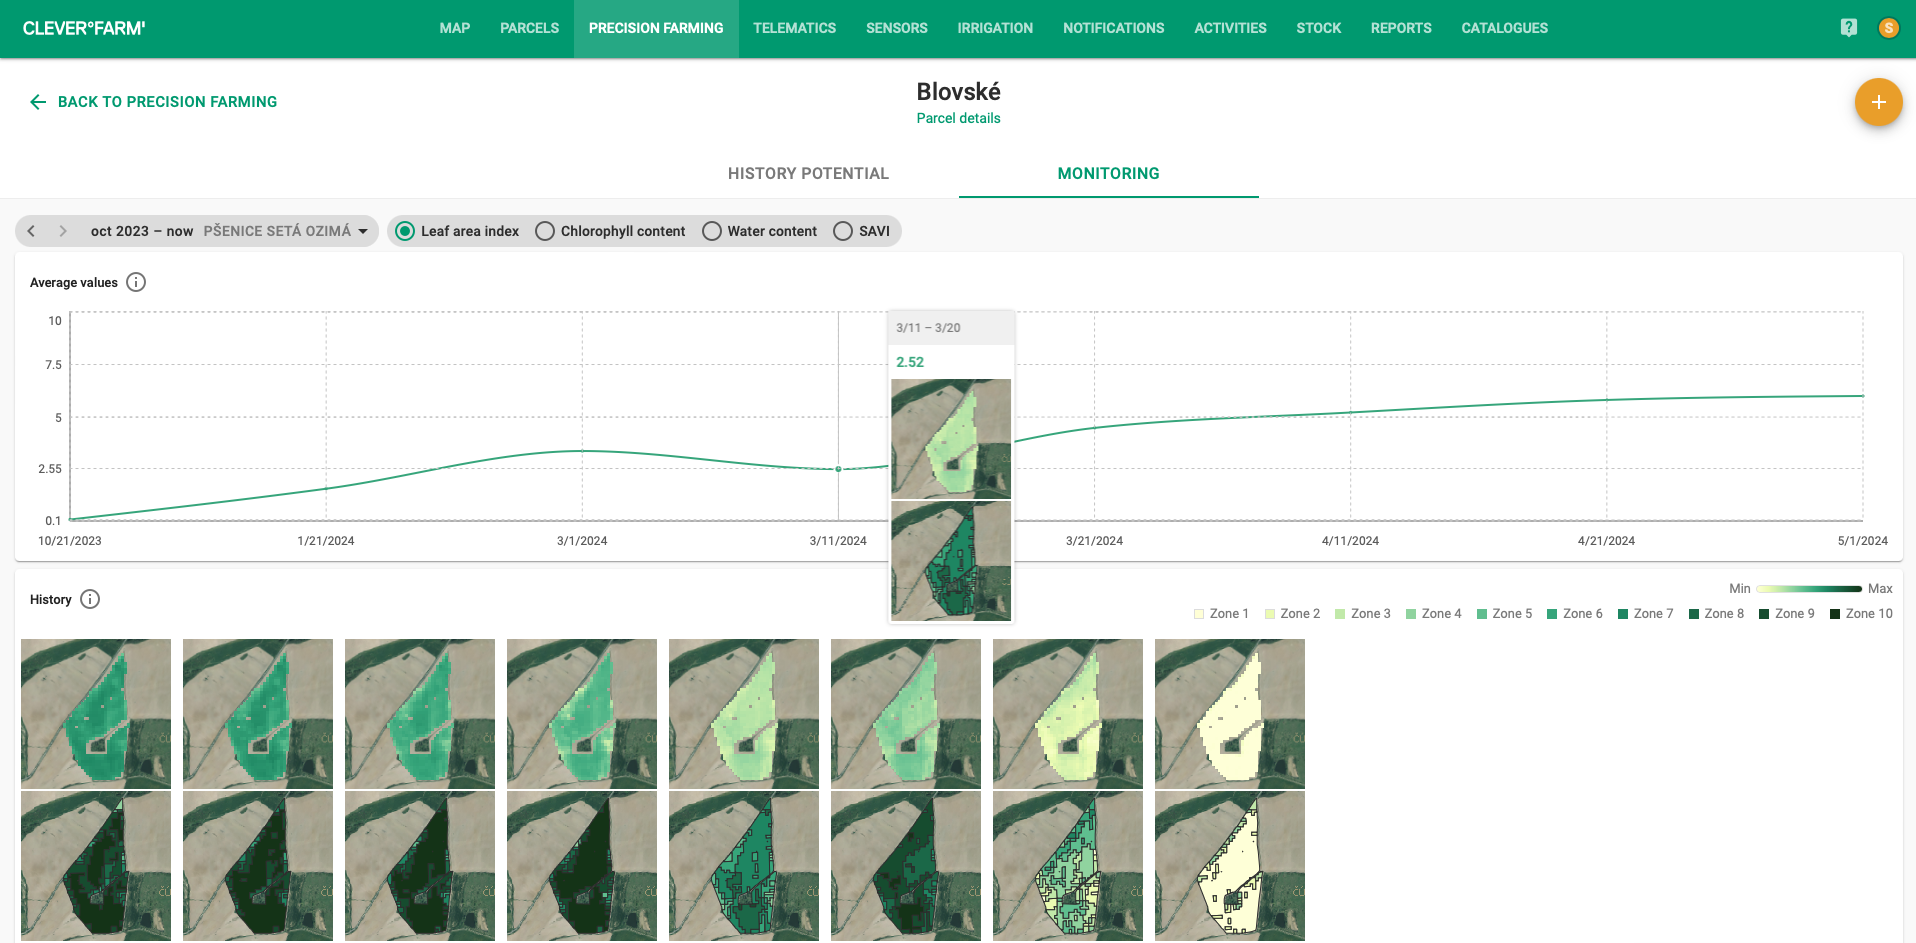
Fig. 3: Sample product showing leaf area index on wheat crops as of 11 March 2024. The difference in stand density can be seen in the sample.
Since the calculation of the above biophysical parameters is optimized for each crop, knowledge of the crop currently grown on the evaluated plots is necessary to generate these products.
In terms of crops (or crop groups) for which the above products can be generated, the following categories are considered:
- winter cereals (winter wheat, winter barley, winter rye...),
- spring cereals (spring barley, spring wheat, spring rye, oats...),
- forage crops (alfalfa, clover...),
- winter rape, sugar beet and maize.
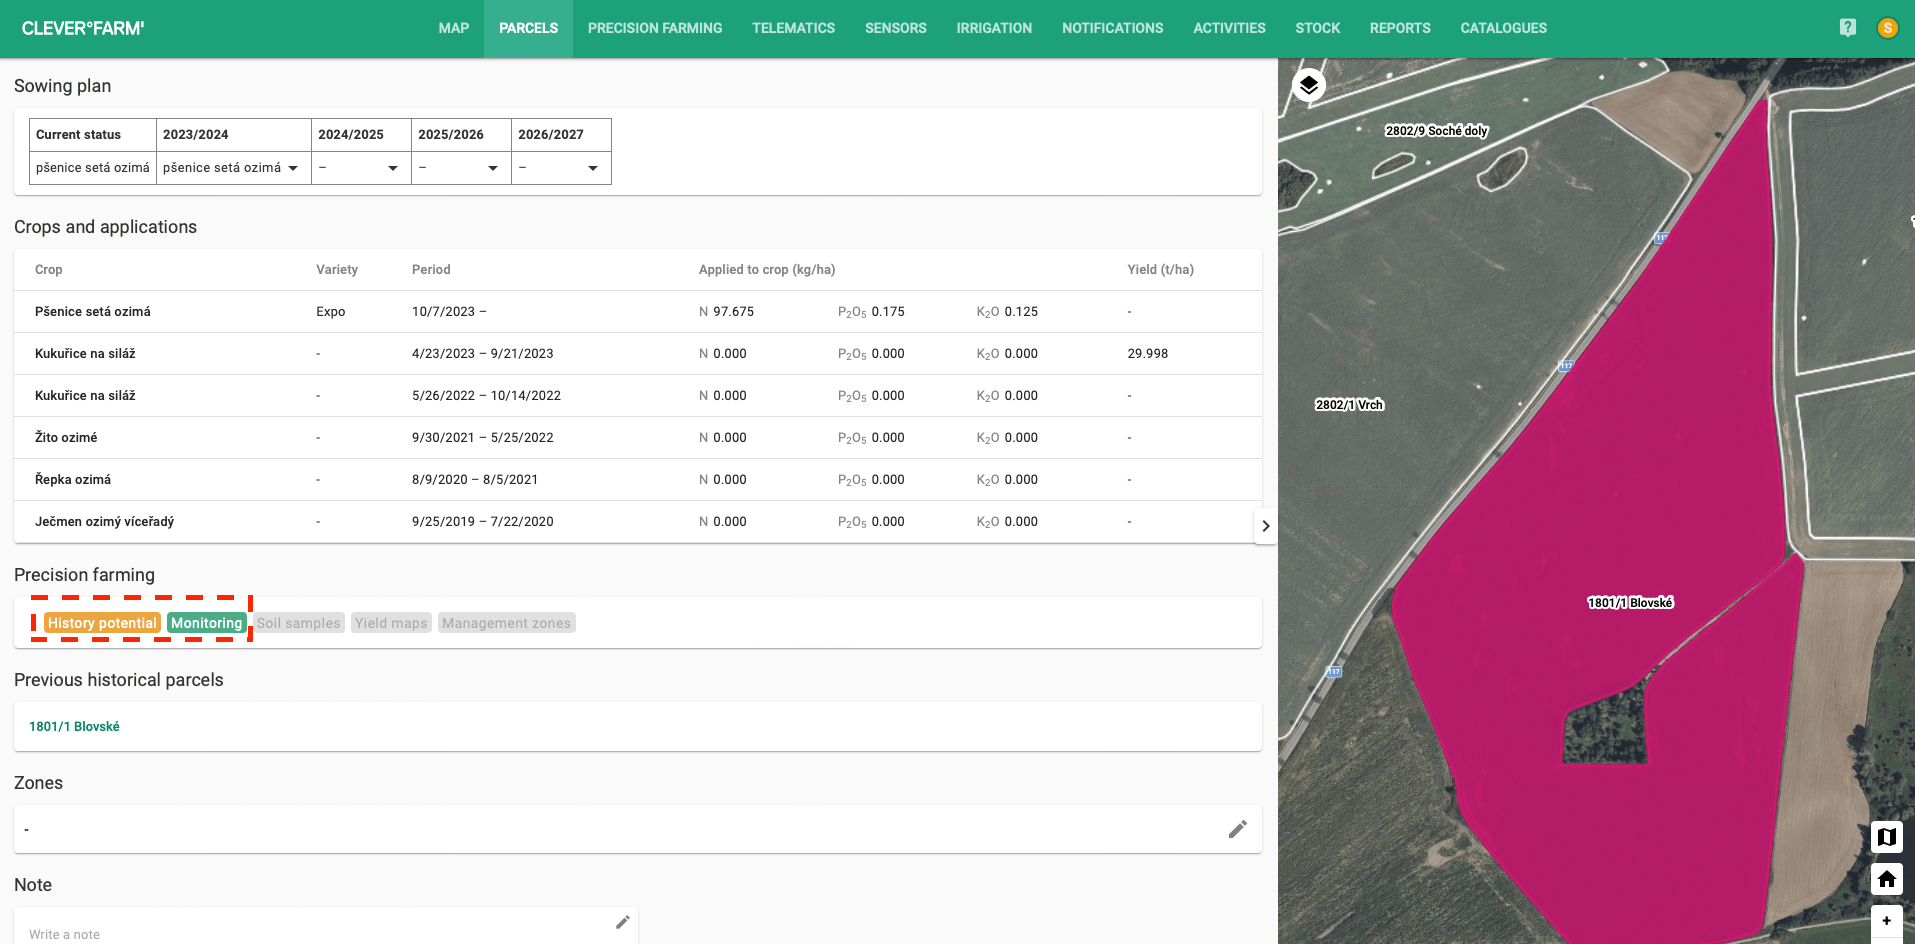
Fig. 4: Monitoring and Growth Potential tabs on the parcel detail
The service for monitoring biophysical parameters of the stand can be found on the plot detail under the MONITORING tab. Contact our sales staff to activate the service at sales@cleverfarm.cz.