
Crop growth potential
Growth potential determination is one of the products of satellite data processing. It helps you to determine the stand variability of your land for different agricultural crops by analysing a long-term time series of satellite images. The variability is described using a stand engagement indicator derived from the satellite data.
By analysing historical images, you can identify long-term problematic parts of agricultural land and categorise them into so-called management zones. The result is a division of the plot into typically three performance categories and a determination of the relative growth potential on the plot. If high variability is found on the plots, it is advisable to apply the principles of precision agriculture.
Map of crop growth potential
The map is based on a spatial and temporal analysis of crop involvement using satellite data. It is based on a minimum 10-year time series of satellite images selected to best capture the main stages of crop growth in each year. The map is prepared separately for selected crops that are grown repeatedly on the monitored plot (in at least 3 growing seasons). As part of the evaluation of the spatial variability of cropping patterns, zonation is performed to identify long-term problematic areas of the plot for each monitored crop. Years in which any random or exceptional vegetation conditions are identified are excluded from the evaluation.
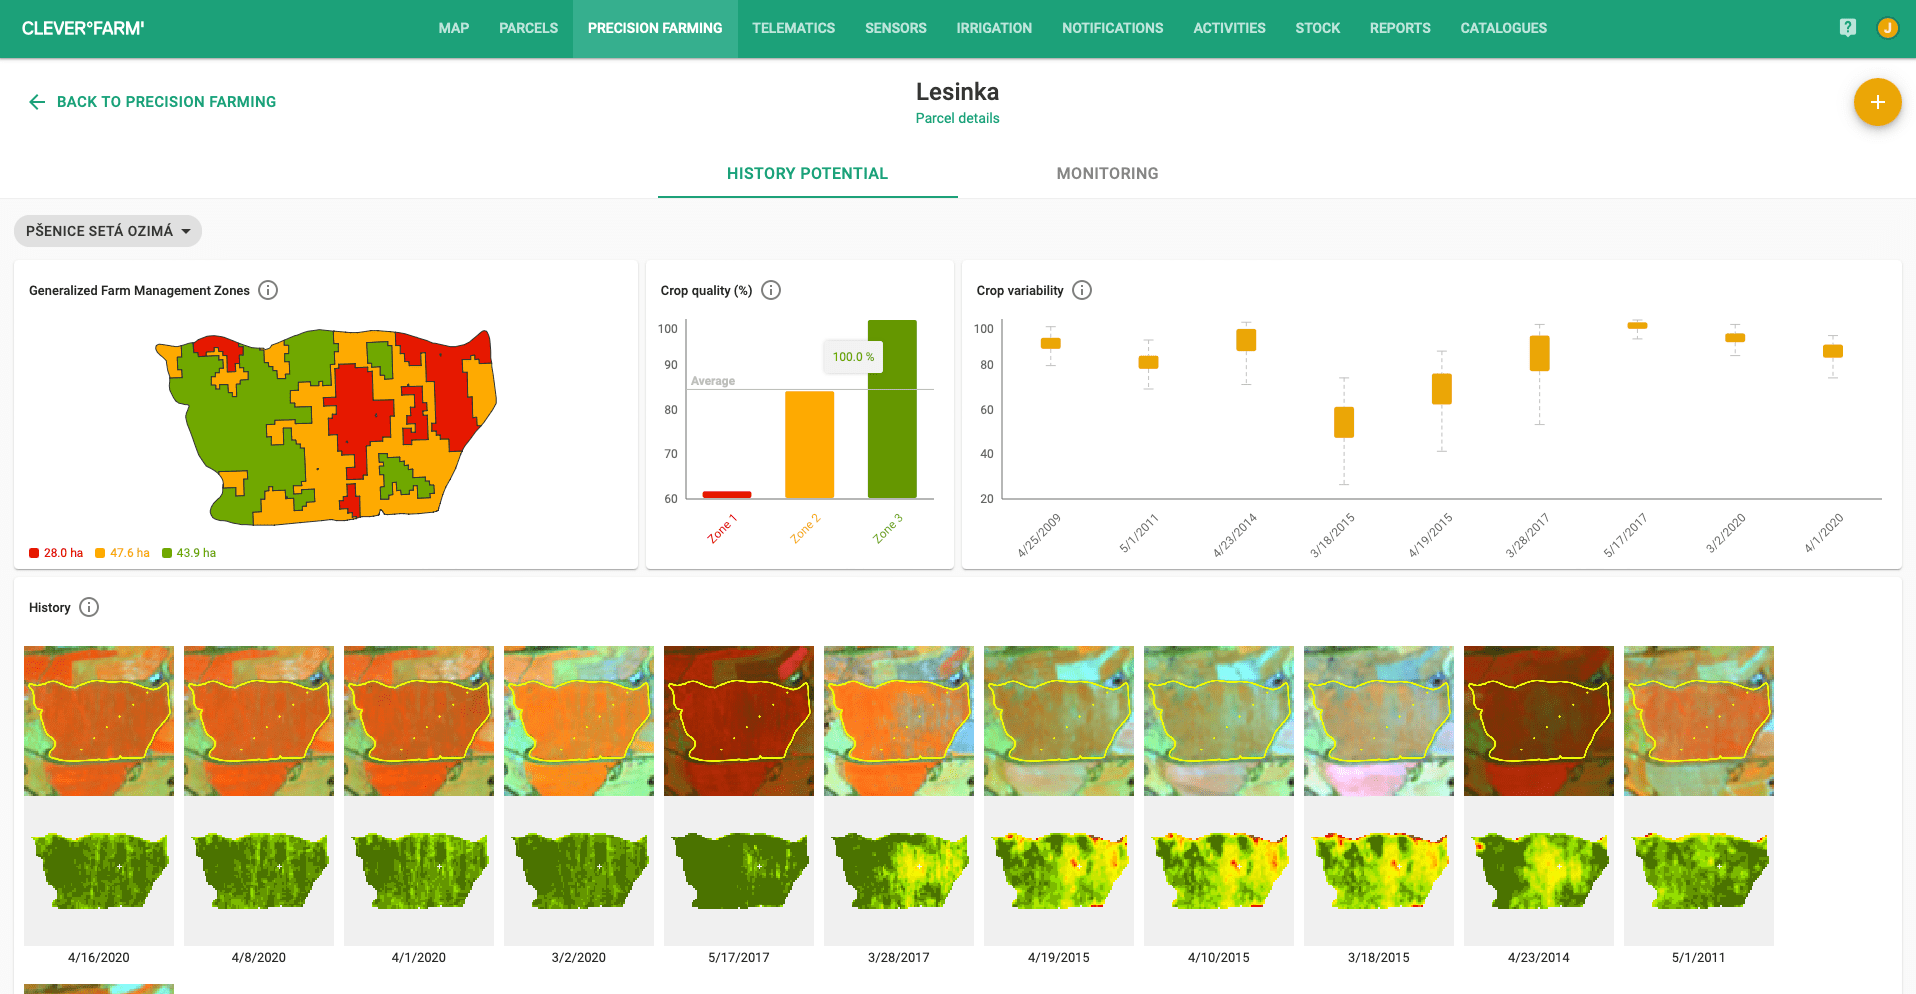
Fig. 1: Growth potential map
Based on a multitemporal analysis of a time series of harmonized stand engagement maps from the entire period under study, the variability of individual crops on a given plot is first evaluated. The aim of this step is to select plots showing significant variability in the long term. For these plots, a spatio-temporal segmentation of the whole time series is then carried out, based on which a categorisation of the involvement and delineation zones is made. Finally, the reference zone with the highest long-term average engagement is identified and its untapped average potential relative to the reference zone is calculated for each additional zone. The final product of the whole processing is a vector layer of zone management with the assigned relative potential of each zone.